As I mentioned last time, SurveyUSA say that their poll shows the Democrats taking the White House whether Clinton or Obama is the nominee. However, in both cases it's a rather nail-biting victory, in a different way for each.
This chart illustrates the fight they face. We draw the states ordered by the margin of difference between the candidates, so the most heavily Democratic are on the left. The width of the bar indicates the number of electoral college votes, and the line across the middle is the half-way mark. Whichever candidate takes the state indicated by the middle line wins the election. Here's what the 2004 election looks like - it should be clear for example that if Ohio had gone the other way, then New Mexico and Iowa wouldn't have been enough to grant the Republicans victory. I've used the 2004 data to fill in DC's vote, since SurveyUSA didn't poll it.
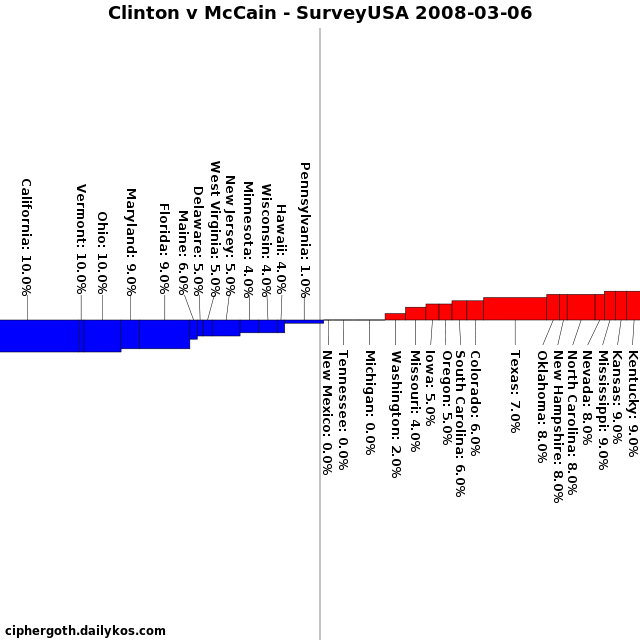
(This shows only the middle of the chart - click on the chart to see a wider version with all 50 states and DC)
Clinton wins the election according to this poll, because she wins Pennsylvania; however, she wins it by a 1%. Flip Pennsylvania the other way - or any state with eight or more electoral votes - and the election goes the other way.

For Obama things are even scarier. You can see that he lifts the Democratic vote overall - the blue area is thicker overall and the red thinner - but both Virginia and New Jersey are shown as tied with McCain, and Obama needs one of them to win. If either goes Blue then Obama is in, but if the Republicans can keep Virginia and take New Jersey they get another four years. Unless Obama can take Texas from them, in which case its 34 electoral votes will give the Democrats a huge victory even if they lose some smaller states like New Hampshire along the way.
